Trading Alert – Calling a Stock Market Crash Between End of August, End of September

I explain why here.

Read that first.

Yesterday I entered the following positions in order to prepare:

4 contracts XBI Sept. 15, 2017 61 PUT, at $0.19 a contract, total cost $76

17 contracts XBI Sept. 15, 2017 62 PUT, at $0.21 a contract, total cost $425

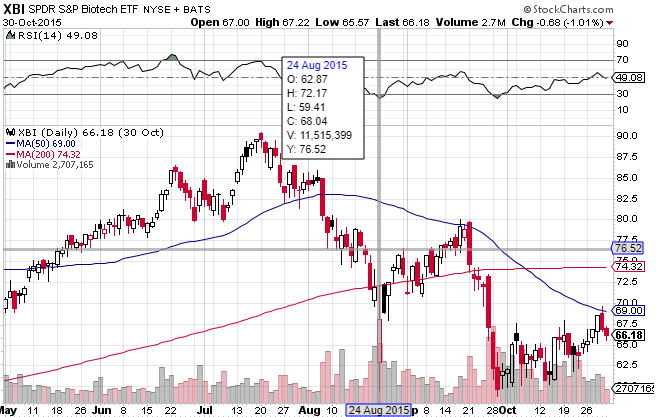
From July 18th, 2015 (today) to the low on August 24th, 2015, XBI fell 33%.

I’m expecting something similar to happen again. My guess is August 27th but it could be any time before October.

If what happened then plays out again, the target low on XBI will be $52.50.

At that price, the 61 PUTs will be worth $8.50. The 62 PUTs will be worth $9.50.

Total risk = $501

Maximum gain on 61 PUT: $3,324

Maximum gain on 62 PUT: $18,801

XBI on August 24th, 2015:

Advertisement

“Rafi, you’ll have come up with your own topic today, we’re too busy with the market collapse.”

I just called one of my editors for a topic. He answers the phone and I hear screaming in the background. I ask if everything is OK. He says yeah.

And he tells me, “Sorry, you’ll have to come up with your own topic today. We’re too busy with the market collapse.”

We ain’t seen nothin’ yet.

The Fed is about to Be Squeezed into a Corner

At the end of my recent column for CalvinAyre, I wrote the following:

US securities have a possible day of reckoning coming in around 3 weeks. Take a look at the latest money stock measures release, and you’ll notice that in the final column of table 2, the three figures above $12T occupy the first 3 rows. In 3 weeks, those numbers will be off the quarterly table, and the 13 week average two columns over will plummet if we don’t decisively break through $12T consistently in the next 3 weeks. Assuming weekly money supply stays constant by July 30, money supply will have actually shrunk on a quarterly basis.

Keep in mind that this is not a magic number game and there’s nothing inherently special about a declining quarterly money supply average that necessitates a crash. It just greatly increases the chance of one happening. And the last time money supply shrunk on a quarterly basis was the weekend of September 25, 2008. It has never done that since.

The last three weeks have been interesting though. Demand deposits have increased by $231B, but savings deposits have decreased by $292B, a net $61B loss in money supply. That tells me that savings are being moved to checking accounts for spending purposes. Does that movement hint at signs for the next 3 weeks? Possibly. Increases in demand deposits usually correspond with decreases in savings deposits. An increase in both in the same week is very rare, and that is what we’d need to top $12.1T. It doesn’t look like we’re going to make it. Not in three weeks anyway.

If it does happen in the next three weeks and it triggers a selloff, the Fed may have ironically lost its window of opportunity to raise the Federal Funds Rate as it has been threatening to do for months.

There’s a machlokes (argument) here between Bob Wenzel on one hand, and Ron Paul and Peter Schiff on the other. Paul and Schiff believe the Fed will never raise interest rates ahead of the market forcing them to do so, and QE4 or 5 is coming. Wenzel believes that the Fed will raise interest rates and QE is off the table.

I have sided with Wenzel, until now. In 3 weeks, we could be headed for a market crash. We’ll find out in a week or two. If money supply doesn’t jump quickly by Thursday when the next report comes out, it looks like a real possibility. And the response of the Fed to a crash will be more QE.